Instructor Contact Information
Instructor: Ellen Fireman, Email: fireman@illinois.edu
3 Course Websites
1. Public Stat100 Netmath website
Exam Study Guides, Data Program, p-value calculator and General Course Information are posted on the Public Course Website.
https://stat100netmath.web.illinois.edu
2. LON-CAPA site
All homework, surveys and bonus work are submitted and graded immediately on Lon Capa.
http://www.lon-capa.illinois.edu
3. Compass/ Canvas site
All grades and announcements are posted on Compass
https://compass2g.illinois.edu
or Canvas
https://canvas.illinois.edu
(Lon-Capa's gradebook is confusing so always check your grades on Compass/Canvas.)
Office Hours
We'll be using ZOOM for individual help. See the ZOOM office hour schedule on the Compass/Canvas course site.
Technical Issues
If you experience a glitch in Lon Capa/Compass/Canvas, first, try logging out and logging back in.
If this doesn't work, send me an email describing the problem to our e-learning specialist Yuk Tung Liu at ytliu@illinois.edu. Please make sure to include a screenshot of the error in your e-mail.
Course Materials
- Required Workbook: Stat 100 Incomplete Lecture Notes Workbook by Ellen Fireman, Karle Flanagan, and John Marden
- You will fill out this notebook while watching the lectures or lecture videos for extra credit. It's essential to understanding and remembering the course material for both in class and online students.
- Calculator- You may use any calculator you like.
Homework
There will be two homework sets each week. See the HW schedule in the course calendar on the Compass/Canvas site. Ask questions on Lon Capa discussion boards and if you need more help, don't hestitate to come to the Zoom office hours.
(No late hw accepted but lowest 3 hw scores dropped)
There will be 3 midterm exams and a cumulative Final. See the exam schedule on the Compass/Canvas site.
Grade for Required Work
| 3 Midterm Exams (each worth 15%) | 45% |
| Final Exam | 20% |
| HW assignments (lowest 3 dropped) | 35% |
Overall Grade is Translated into a Letter Grade as follows:
| A+ |
97-100 |
A |
93-96.99 |
A- |
90-92.99 |
| B+ |
87-89.99 |
B |
83-86.99 |
B- |
80-82.99 |
| C+ |
77-79.99 |
C |
73-76.99 |
C- |
70-72.99 |
| D+ |
67-69.99 |
D |
63-66.99 |
D- |
60-62.99 |
|
|
F |
< 60 |
|
|
Bonus Work
Bonus Points &mbdash; You may earn between 0 and 100 Bonus Points.
Everyone may earn between 0 and 100 Bonus Points. Every bonus point earned helps your overall grade, but even if you do no bonus work, you can still get 100% for the course. In other words, bonus points can only help you. Bonus points are extra credit. Here's how you can get them:
- Pre-Lecture Bonus problems (50 bonus points)
There will be short pre-lecture videos posted on Lon Capa followed by a few questions. The pre-lectures are designed to give you a preview of the basic concepts you'll see in the actual lectures.
- Completed Notebook (50 bonus points)
We will look over your notebook at the final. You'll get full credit if you have all the pages from lecture filled in.
* Bonus points can only help you. You can still get 100% in this class without doing any bonus work.
Bonus points are figured into your grade as follows:
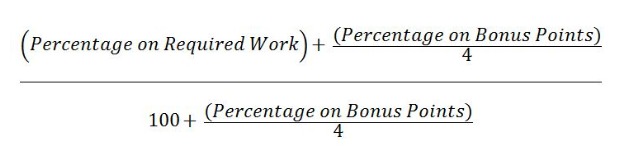
Suppose at the end of the semester you have a 75% average and you did 100% of the bonus work.
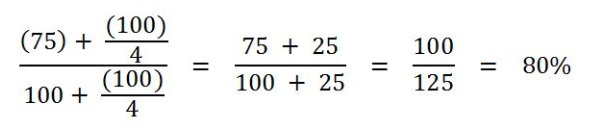
So your grade would be raised from a 75% (C) to an 80% (B-).
Course Outline
- Study Design: observational studies vs. randomized experiments, why randomized controls are key, confounders in observational studies, Simpson’s Paradox, intent to treat analysis, etc.
- Descriptive Statistics: mean, median, SD, histograms, box plots, normal curve, etc.
- Linear Regression: correlation coefficient, simple linear regression, the RMSE, etc.
- Probability: chance, multiplication rule, addition rule, conditional probability, Bayes rule, etc.
- Statistics for Random Variables: expected value and standard error of chance processes, probability histograms and the Central Limit Theorem, developing simple chance models box models that more complicated sampling processes can be translated into, the Law of Averages, etc.
- Sampling and Statistical Inference: using sample means and percents to estimate population means and proportions, attaching margins of errors to our estimates by computing confidence intervals, why randomized sampling is key, etc.
- Significance Tests: one sample and two sample z-tests, t-tests, and chi-square tests for goodness of fit and independence, the focus is on understanding how these tests depend on chance models.
- Limits of Significance Tests: understanding what the p-value means and under what circumstances it is valid (for example, hypotheses must be stated before looking at the data, the total number of experiments before significant results were found must be reported, etc.)